

TORONTO, Sept. 6, 2022 /CNW/ - O3 Mining Inc. (TSX.V: OIII) (OTCQX: OIIIF) ("O3 Mining" or the "Corporation") is pleased to announce the completion of the Pre-Feasibility Study ("PFS"), prepared in accordance with the National Instrument 43-101 – Standards of Disclosure for Mineral Projects ("NI 43-101"), for its 100% owned Marban Engineering gold project, in the world-class mining region of Val-d'Or in Québec, Canada. All figures are expressed in Canadian dollars unless otherwise stated.
- Robust Project Economics: Post-tax net present value ("NPV") (discount rate 5%) of C$463 million and post-tax unlevered internal rate of return ("IRR") of 23.2% using a long-term gold price of US$1,700 per ounce and an exchange rate of C$1.00 = US$0.77.
- Increased production profile: Annual average production increased from 115,000 ounces of gold ("oz Au") in the Preliminary Economic Assessment ("PEA") to 161,000 oz Au supported by a 50% increase in mill throughput, 15% increase in peak mine rate, lower cut-off grade of 0.30 g/t Au compared to 0.35 g/t Au in the PEA, lower strip ratio of 5.1 and increased mill gold recovery.
- Low capital intensity: Initial capital ("CAPEX") of C$435 million including mine preproduction, processing, and infrastructure (roads, power distribution, tailings facility, ancillary buildings, and water management). Capital intensity ratio ("NPV/CAPEX") of 1.1x per dollar invested.
- Competitive cost profile and rapid payback: All-in-Sustaining Cost ("AISC") of US$882 per ounce, a post-tax payback of 3.5 years, with C$1,971 million EBITDA and C$760 million post-tax free cash flow over the life of mine ("LOM").
- Optimization and exploration upside towards Feasibility Study in 2023: Well-funded to perform trade-off studies assessing new technologies including autonomous haulage and trolley assist mine fleet that may impact project economics and reduce environmental footprint. Additionally, O3 Mining will continue with a brownfield exploration program on Marban Engineering including the expansion of all lateral extensions of the near-surface mineralization, unlock the potential in the Hygrade Fold area (North-West of Kierens pit) as well as the downdip extension of the Marban deposit.
Jose Vizquerra, President and CEO, states: "We are pleased with the results of our PFS for the Marban Engineering Project which demonstrates the potential to be the next gold producer in the Abitibi region in Val-d'Or, Quebec, the next step in delivering on our promise to be in production by 2026. With robust economics, Marban has shown itself to be a profitable standalone project. Using a long-term gold price of US$1,700 oz gold, the project has a post-tax unlevered IRR of 23.2% well above the 15% IRR investment threshold used by many larger gold miners, and a post-tax NPV of C$463M as well as an NPV/CAPEX ratio of 1.1x, with an AISC of US$882 per ounce. This is a key achievement in an inflationary environment in which mining companies are seeing higher cost increases. The project has an improved production profile of over 160,000 oz Au annually, for an approximately 10-year life of mine compared with our 2020 PEA. We believe the opportunity to grow Marban remains high, with many mineralized zones not included in the Mineral Resource Estimate, which could add to the LOM, and further improve Marban's economics. Current drilling at the Hygrade Fold area (North-west of Kierens pit) has the potential to add to the current resource within the greater Marban Engineering Project. We have the privilege to be developing Marban in a jurisdiction that has a green-powered grid with 99.6% renewable power and that has a strong carbon policy. Compared to other jurisdictions developing gold mines, Quebec's carbon intensity is one of the lowest in the world. Work on the feasibility-level studies has begun which we expect to complete in 2023. O3 Mining continues to deliver on all milestones and stated goals as we continue our progress towards production, and creating fundamental value with the Marban project for our shareholders and other stakeholders."
O3 Mining Webinar to be held on September 6th, 2022 at 11:00 a.m. EST – REGISTER HERE
Marban Engineering PFS Presentation available here: VRIFY Presentation
The Marban project is located between the cities of Malartic and Val d'Or in the Abitibi gold district of Québec, Canada. The project area contains six past-producing mines, which collectively produced 585,000 ounces of gold between 1959 and 1992. The land package owned by O3 Mining, in the heart of these mining camps, covers 125 square kilometres and is located 12 kilometres from the Canadian Malartic Mine and along the same shear structure as Wesdome Gold Mine's Kiena deposit.
- The PFS is based on the updated Mineral Resource Estimate ("MRE") from March 1, 2022 (see press release).
- The PFS project team was led by Ausenco Engineering Canada Inc. ("Ausenco"), an industry leader in cost-effective design and construction. Ausenco was supported by G Mining Services ("G Mining") and WSP Canada ("WSP").
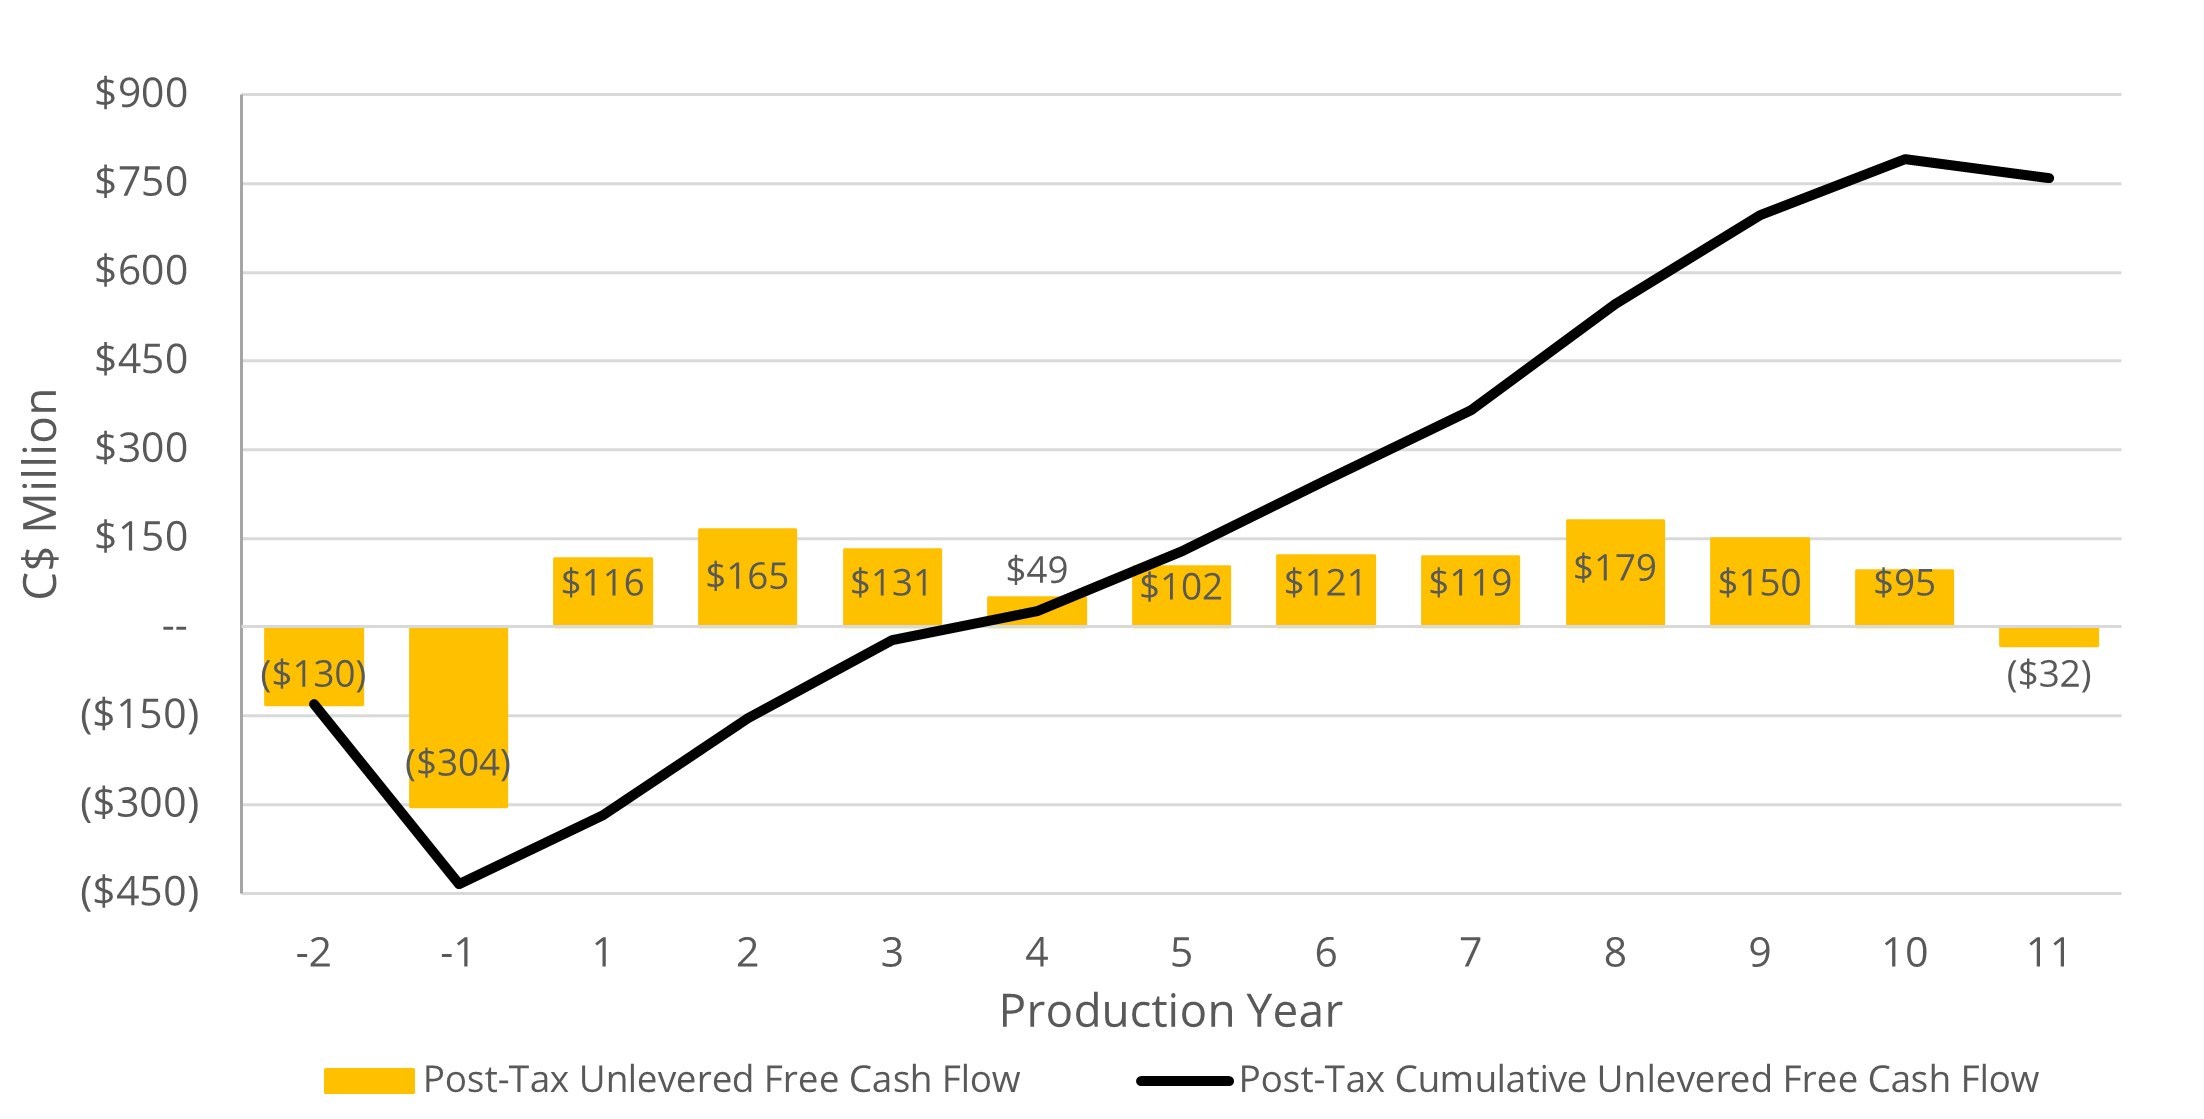
The economic analysis was performed assuming a 5% discount rate. On a pre-tax basis, the NPV is $775 million, the IRR is 30.2% and the payback period is 2.8 years. On a post-tax basis, the NPV is $463 million, the IRR is 23.2% and the payback period is 3.5 years. A summary of the project economics is listed in Table 1 and shown graphically in the figures below.
Table 1: Summary of project economics
|
General |
||
|
Gold Price |
US$/oz |
$1,700 |
|
Exchange Rate |
US$:C$ |
$0.77 |
|
Mine Life |
years |
9.6 |
|
Total Waste Tonnes Mined |
kt |
286,144 |
|
Total Mill Feed Tonnes |
kt |
56,436 |
|
Strip Ratio |
w:o |
5.1 |
|
Production |
||
|
Mill Head Grade LOM |
g/t |
0.91 |
|
Mill Recovery Rate |
% |
94.2 |
|
Total Mill Ounces Recovered |
koz |
1,552 |
|
Total Annual Average Production |
koz |
161 |
|
Operating Costs |
||
|
Mining Cost |
C$/t Mined |
$2.6 |
|
Mining Cost |
C$/t Milled |
$15.9 |
|
Processing Cost |
C$/t Milled |
$7.8 |
|
G&A Cost |
C$/t Milled |
$1.4 |
|
Total Operating Costs |
C$/t Milled |
$25.1 |
|
Refining & Transport Cost |
C$/oz |
$2.5 |
|
Cash Costs* |
US$/oz |
$723 |
|
AISC** |
US$/oz |
$882 |
|
Capital Costs |
||
|
Initial Capital |
C$M |
$435 |
|
Sustaining Capital |
C$M |
$283 |
|
Closure Costs |
C$M |
$49 |
|
Salvage Value |
C$M |
$10 |
|
Financials - Pre Tax |
||
|
NPV (5%) |
C$M |
$775 |
|
IRR |
% |
30.2 |
|
Payback |
years |
2.8 |
|
Financials - Post Tax |
||
|
NPV (5%) |
C$M |
$463 |
|
IRR |
% |
23.2 |
|
Payback |
years |
3.5 |
|
Notes |
|
* Cash costs consist of mining costs, processing costs, mine-level general & administrative expenses and refining charges and royalties. |
|
** AISC includes cash costs plus sustaining capital, closure cost and salvage value. |
")
Figure 1: Projected Annual and Cumulative LOM Post-Tax Unlevered Free Cash Flow
 (CNW Group/O3 Mining Inc.)")
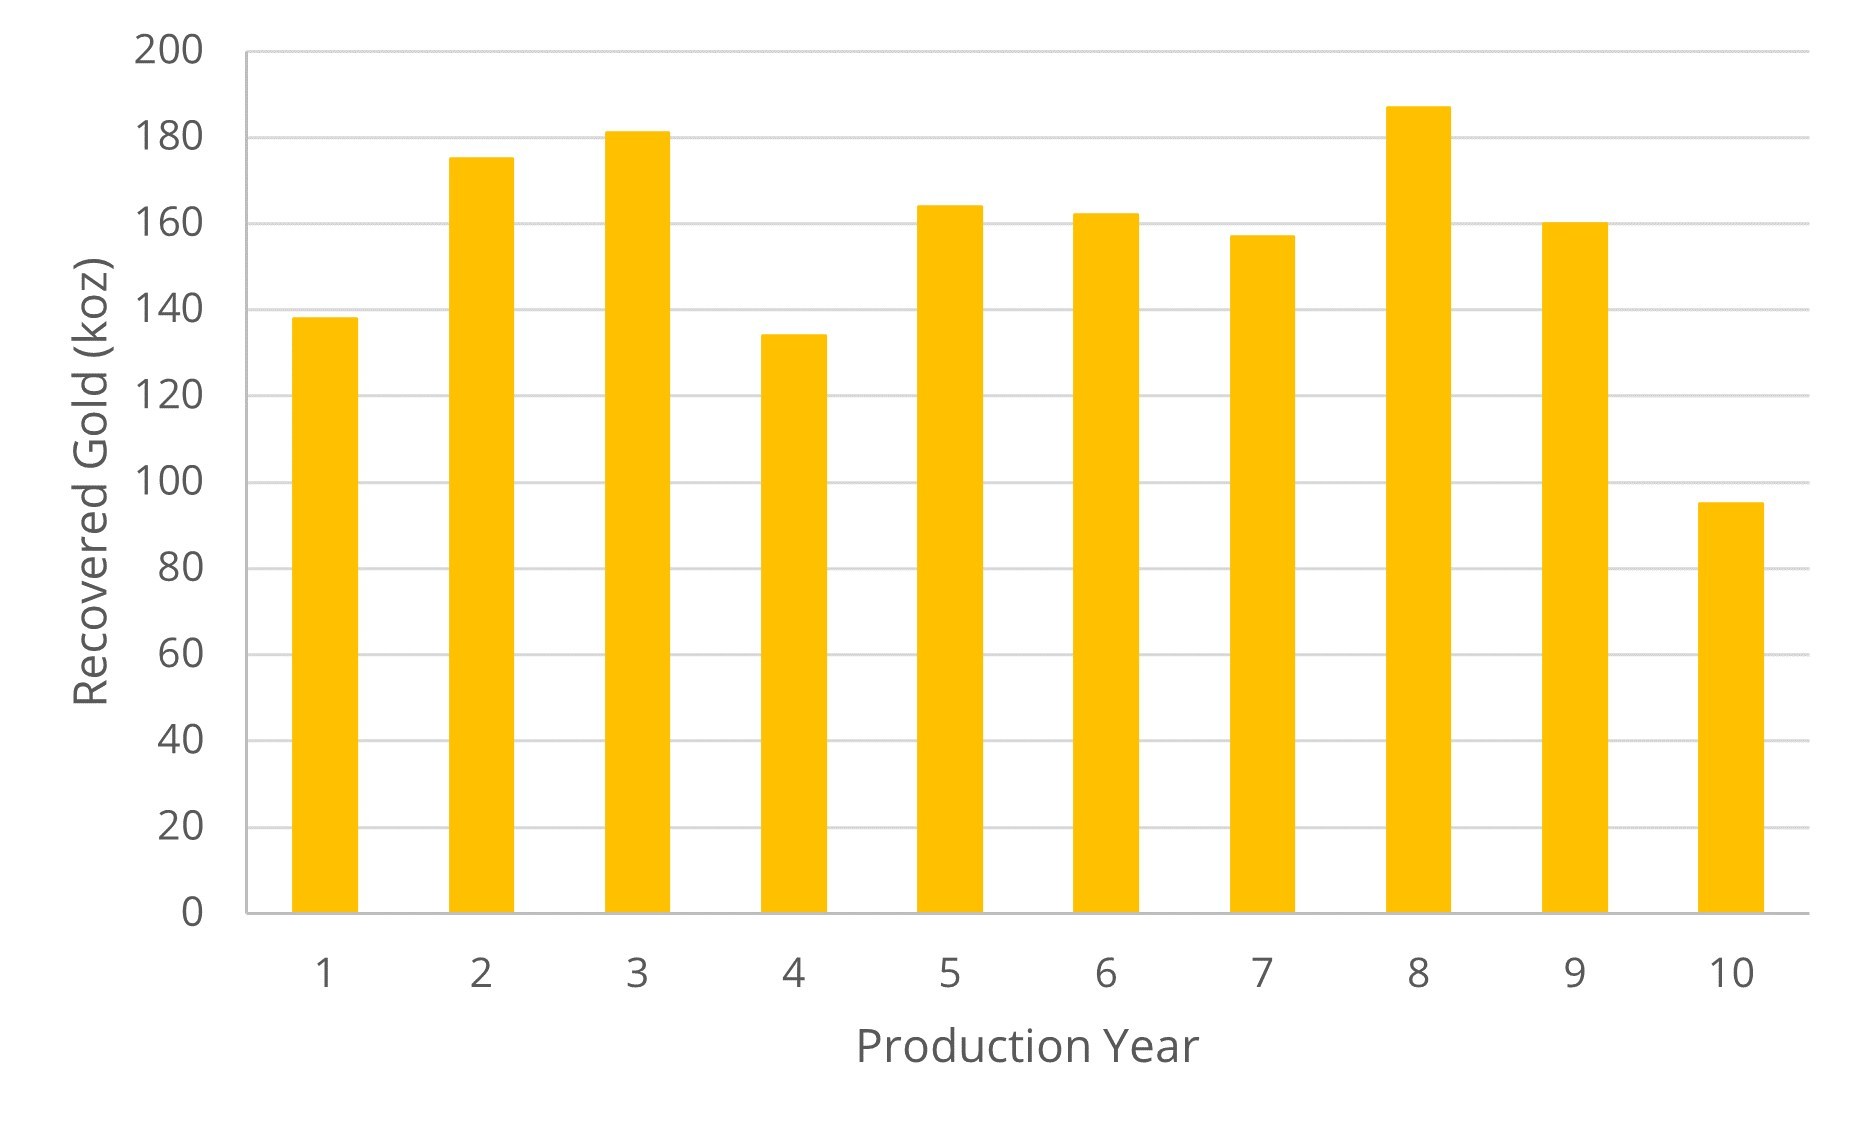
Figure 2: Projected LOM Production (Koz)
A sensitivity analysis was conducted on the base case after-tax NPV and IRR of the Marban project, using the following variables: gold price, total CAPEX (initial + sustaining), total operating cost, and US$:C$ exchange rate. The tables below provide a summary.
Table 2a: Post-Tax NPV (5%) Sensitivity, C$M
|
Gold Price |
Base Case |
Total Capex |
Total Capex |
Opex |
Opex |
FX |
FX |
|
$1,500 |
$281 |
$345 |
$217 |
$348 |
$213 |
$148 |
$411 |
|
$1,600 |
$373 |
$438 |
$309 |
$437 |
$306 |
$232 |
$510 |
|
$1,700 |
$463 |
$527 |
$398 |
$526 |
$398 |
$316 |
$606 |
|
$1,800 |
$552 |
$616 |
$487 |
$614 |
$488 |
$398 |
$703 |
|
$1,900 |
$639 |
$704 |
$575 |
$701 |
$577 |
$478 |
$798 |
Table 2b: Post-Tax IRR Sensitivity
|
Gold Price |
Base Case |
Total Capex |
Total Capex |
Opex |
Opex |
FX |
FX |
|
$1,500 |
16.4 % |
20.2 % |
13.2 % |
19.1 % |
13.6 % |
11.1 % |
21.2 % |
|
$1,600 |
19.9 % |
24.0 % |
16.5 % |
22.4 % |
17.3 % |
14.5 % |
24.8 % |
|
$1,700 |
23.2 % |
27.5 % |
19.6 % |
25.6 % |
20.8 % |
17.9 % |
28.1 % |
|
$1,800 |
26.4 % |
31.0 % |
22.5 % |
28.7 % |
24.0 % |
21.0 % |
31.4 % |
|
$1,900 |
29.4 % |
34.2 % |
25.3 % |
31.6 % |
27.2 % |
23.9 % |
34.5 % |
The PFS is based on the Open Pit Indicated portion of the Marban Mineral Resource Estimate, as published in "Marban Engineering NI 43-101 Technical Report & Mineral Resource Estimate".
The Proven and Probable Ore Reserves for the Marban project are estimated at 56.4 Mt at an average grade of 0.91 g/t Au for 1,647 Koz of contained gold at 0.3 g/t Au cut-off grade as summarized in Table 3. The Mineral Reserve is included within the Mineral Resource.
Table 3: Open-Pit Mineral Reserve (effective date August 17, 2022)
|
Category |
Tonnage |
Grade |
Contained Gold (Koz) |
|
Proven |
- |
- |
- |
|
Probable |
56,437 |
0.91 |
1,647 |
|
Proven and Probable |
56,437 |
0.91 |
1,647 |
|
Notes: |
|
1. The Mineral Reserve is estimated using the Canadian Institute of Mining, Metallurgy and Petroleum (CIM), Estimation of Mineral Resources & Mineral Reserves Best Practice Guidelines (November 29, 2019) and CIM Definition Standards for Mineral Resources & Mineral Reserves, May 19th, 2014. |
|
2. The Qualified Person for the estimate is Mr. Carl Michaud, Eng. M.B.A., Vice President of Mining Engineering for GMS. Effective date of the estimate is August 17, 2022. |
|
3. Mineral reserves are estimated for a long-term gold price of US$ 1,600/oz. |
|
4. Mineral reserve cut-off grade is 0.3 g Au/t for all materials. |
|
5. A dilution skin width of 1 metre was considered resulting in an average mining dilution of 5.4%. |
|
6. The average strip ratio is 5.07:1. |
|
7. Numbers may not add due to rounding. |
The Marban Engineering project will be mined with a conventional drill, blast, and haul setup. The project is split into three mining pit groups: Marban, Norlartic, and Kierens which are further split into nine sub pits and phases.
- The peak mining rate is 52.3 million tonnes per year over a mine life of 9.6 years.
- A total of 56.4 million tonnes (Mt) of ore will be mined at an average grade of 0.91 g/t, with a total of 286.1 Mt of waste mined, resulting in a stripping ratio of 5.07 tonnes waste per tonne of ore.
- The primary production equipment includes 16 m3 electric production shovels and 150 tonne off highway mining trucks augmented by a smaller overburden focused secondary fleet of 100 tonne trucks and 5 m3 excavators.
- Stockpile rehandling is minimal with a peak inventory of low-grade material consisting of 0.5 Mt in Production Year 7.
Special considerations are made in the mine plan to mine out the smaller northern pits (Kierens and Norlartic) early to allow in-pit deposition of the processing plant tailings and reduce the project footprint.
Table 4: PFS Mine Plan Production Summary
|
Parameter |
Units |
Life of Mine |
Y-2 |
Y-1 |
Y1 |
Y2 |
Y3 |
Y4 |
Y5 |
Y6 |
Y7 |
Y8 |
Y9 |
Y10 |
|
Total Tonnage Mined |
000 t |
342,580 |
500 |
15,460 |
37,642 |
37,892 |
52,281 |
52,407 |
48,618 |
38,604 |
27,273 |
14,330 |
10,748 |
6,828 |
|
Waste Tonnage |
000 t |
286,144 |
500 |
15,287 |
32,844 |
31,986 |
46,055 |
46,538 |
42,629 |
32,436 |
21,071 |
8,412 |
4,841 |
3,545 |
|
Overburden |
000 t |
48,864 |
500 |
12,857 |
8,440 |
6,997 |
7,014 |
7,003 |
6,039 |
13 |
- |
- |
- |
- |
|
Rock |
000 t |
237,280 |
0 |
2,430 |
24,404 |
24,989 |
39,040 |
39,535 |
36,590 |
32,422 |
21,071 |
8,412 |
4,841 |
3,545 |
|
Strip Ratio |
W:O |
5.07 |
- |
88.71 |
6.84 |
5.42 |
7.40 |
7.93 |
7.12 |
5.26 |
3.40 |
1.42 |
0.82 |
1.08 |
|
Ore Tonnage |
000 t |
56,436 |
- |
172 |
4,798 |
5,906 |
6,226 |
5,869 |
5,989 |
6,168 |
6,202 |
5,918 |
5,907 |
3,282 |
|
Au Head Grade |
g/t |
0.907 |
- |
1.16 |
0.95 |
0.99 |
0.98 |
0.74 |
0.90 |
0.87 |
0.84 |
1.03 |
0.88 |
0.90 |
Metallurgical testing was completed at Base Metallurgical Laboratories ("BaseMet") (independent of O3 Mining) in Q1 2022. The gravity leach test results were analyzed to provide recovery models for use with the mine production schedule.
In addition to the predicted extraction, plant losses include:
- Soluble losses of 0.01 g/t Au
- Carbon losses of 40 g/t
- Fine carbon assays of 80 g/t Au for carbon losses
- Other plant losses of 0.2% Au
Recoveries for ore mined from the Marban and Kierens pits were estimated as 94.9% after plant losses based on the recovery model derived from the gravity leach test results. The Norlartic pit gravity leach tests results provided an estimated leach extraction as a function of head grade, outlined in Table 6.
Table 6: PFS Calculated Recoveries (Gold)
|
Pits |
Head Grade (g/t Au) |
Leach Extraction |
Soluble and other Losses |
Net Recovery |
|
Marban |
0.87 |
95.4 % |
0.5 |
94.9 % |
|
Kierens |
1.09 |
95.4 % |
0.5 |
94.9 % |
|
Norlartic |
1.01 |
Variable |
0.5 |
92.0 % |
|
Total |
0.91 |
0.5 |
94.2 % |
The process flowsheet was designed based on historical and recent test work carried out by Base Metallurgical Laboratories in 2022. The 2022 test work program investigated comminution (Bond Ball Mill Work Index tests), gravity separation, leach optimization, leach variability test work, cyanide detoxification, solid-liquid separation, and pressure filtration. The results indicate that the samples were of medium hardness, with Bond Ball Mill Work Index results ranging from 9.6 to 14.6 kWh/t, and the 75th percentile of the samples tested was 14.1 kWh/t. Historical comminution data was utilized for the balance of crushing and grinding circuits design.
Based on a mine-to-mill analysis, the processing plant capacity has been increased to 6.0 million tonnes per year or 17,900 tonnes per day at 92% availability.
The process design for the project consists of:
- Two-stage crushing, consisting of a primary jaw crusher and a secondary cone crusher with material handling equipment.
- Grinding of crushed material to 80% passing size of 85 μm with a 9.14 m diameter by 4.88 m length SAG mill and a 6.71 m diameter by 10.2 m length ball mill in a closed circuit with hydrocyclones. The SAG mill and ball mill are equipped with 8.0 MW and 8.7 MW motors, respectively.
- A gravity concentration circuit is included in the grinding area. Gravity concentrate will feed intensive cyanidation and will be recovered by electrowinning. Gold recovery of 24.6% is expected from the gravity concentrate.
- Leaching and adsorption circuit includes four leach tanks and six carbon-in-pulp (CIP) tanks, for a total leach and adsorption circuit retention time of 24 hours.
- Cyanide destruction using an SO2/air system on the final tailings slurry.
- Final tails from the cyanide destruction circuit will be thickened and discharged to the tailings storage facility.
The tailings management design was completed by Ausenco, and it is based on conventional thickened tailings storage. There are two storage facilities for the project:
- An initial "starter" tailings storage facility for the first 3.5 years of mill production. This facility is of ring dyke construction type and is located immediately south of the process plant. The design incorporates three phases to build the embankment over the life of the facility. Ultimate storage capacity of this facility is 13.2M m3 (19.3 Mt).
- In-pit deposition in the exhausted Norlartic pit, following the first 3.5 years of mill production through the end of the mine life. Total storage capacity of this pit is 25.4M m3 (37.1 Mt).
The total initial (pre-production) capital cost for the Marban project is estimated to be C$435 million including allowances for contingency of C$44 million. Sustaining costs are estimated to be C$283 million over the life of mine.
Capital and sustaining costs were compiled by Ausenco from the following sources:
- Mining initial capital costs were developed by G Mining, based on the final mine plan. Pre-production of one year was assumed with an owner-purchased and operated fleet.
- Mining sustaining capital costs were developed by G Mining and include major equipment repairs and equipment down payments and loan repayments.
- Processing, infrastructure, project delivery and project indirects were developed by Ausenco, and are inclusive of 6 Mtpa conventional leach/CIP processing plant, power substation, tailings facility initial construction, diversion of Keriens Creek, realignment of Chemin Gervais and other required infrastructure.
- Sustaining capital costs for infrastructure consist of lease repayments for mobile equipment, additional truck shop bays, permanent stockpile cover for the ore reclaim stockpile, two lifts for the initial tailings facility and overland piping installation for in-pit tailings deposition in production Year 4.
Table 7: Initial and Sustaining Capital Costs (C$M)
|
Area |
Initial Capital |
LOM Sustaining Capital |
Total Capital |
|
Mining |
$72 |
$212 |
$284 |
|
Processing |
$161 |
$3 |
$164 |
|
On Site Infrastructure |
$93 |
$65 |
$159 |
|
Off Site Infrastructure |
$12 |
$0 |
$12 |
|
Project Indirects |
$17 |
$1 |
$17 |
|
Project Delivery |
$25 |
$2 |
$27 |
|
Owner's Costs |
$11 |
$0 |
$11 |
|
Contingency |
$44 |
$0 |
$44 |
|
TOTAL |
$435 |
$283 |
$718 |
Operating costs have been compiled based on the following sources and assumptions:
- Mining unit costs have been estimated by G Mining based on 2022 quotes and database costs.
- Processing units costs have been estimated by Ausenco from first principles, using 2022 prices for major reagents and media.
- G&A costs are based on benchmark salary tables for staff positions and other costs from Ausenco databases. Due to the location of the project close to the town of Val D'Or, a camp and general administration offices are not included in the project scope; skilled workers are available locally and offices will be rented in Val D'Or for administrative staff.
Table 8: Total Life of Mine Operating Costs
|
Area |
Cost per Tonne Mined (C$) |
Cost per Tonne Milled (C$) |
Total LOM Operating Costs (C$M) |
|
Mining - Ore and Waste |
$2.62 |
$15.92 |
$898 |
|
Processing |
n/a |
$7.84 |
$442 |
|
General & Administrative (G&A) |
n/a |
$1.38 |
$78 |
|
TOTAL |
$2.62 |
$25.14 |
$1,419 |
In addition to applicable regulations, the Marban project will require social acceptability. Early information and consultation meetings have been held with local communities, First Nations Communities, local, provincial, and federal governmental authorities to initiate collaborative work to obtain social acceptability of the project.
The project will be subject to the regulations under the Canadian Impact Assessment Act and Québec's Environmental Quality Act. The environmental baseline studies are well advanced which will permit the initiation of the environmental impact studies.
O3 Mining will continue to regularly meet stakeholders as project milestones are reached and will be presenting and discussing the PFS results with the host communities.
Following the release of this PFS, O3 Mining will move the project forward towards the necessary bridging work for the commencement of the feasibility-level studies. The Corporation is well-funded to continue the drilling program on Marban Engineering including the expansion of all lateral extensions of the near-surface mineralization. Additionally, the O3 Mining will be looking to unlock the potential in the Hygrade Fold area (North-West of Kierens pit) as well as the downdip extension of the Marban deposit. Furthermore, an initial project description will be filed with the environmental agencies to initiate the impact process.
Additional trade-off studies will be completed during the bridging phase to the Feasibility Study assessing new technologies including autonomous haulage and trolley assist mine fleet that may impact project economics and environmental footprint.
O3 Mining will conduct a webinar to discuss the positive PFS results for Marban Project.
Date and Time: Tuesday, September 6th, 2022, 11:00 a.m. EST
Registration: O3 Mining Marban PFS Update
Details: Participants will be able to submit questions. A recording of the webinar will be made available on o3mining.com following the webinar. If you have any technical difficulties, please email info@o3mining.com
The scientific and technical information contained in this news release has been reviewed and approved by Mr. Louis Gariépy, P.Geo (OIQ #107538), Vice President Exploration of O3 Mining, who is a "qualified person" within the meaning of NI 43-101.
Half-core samples are shipped to Agat laboratory in Val-d'Or, Québec and Mississauga, Ontario for assaying. The core is crushed to 75% passing -2 mm (10 mesh), a 250 g split of this material is pulverized to 85% passing 75 microns (200 mesh) and 50 g is analyzed by Fire Assay (FA) with an Atomic Absorption Spectrometry (AAS) finish. Samples assaying >10.0 g/t Au are re-analyzed with a gravimetric finish using a 50 g charge. Commercial certified standard material and blanks are systematically inserted by O3 Mining's geologists into the sample chain after every 18 core samples as part of the Quality Assurance, Quality Control ("QA/QC") program. Third-party assays are submitted to other designated laboratories for 5% of all samples.
Historic assays have been validated through extensive validation procedures and analyses. Re-assaying of historic drilling is ongoing with re-assayed values included in the resource estimate. Data prior to 1984 that has not been re-assayed has not been included in the resource estimate due to lack of QA/QC. The drill program design, QA/QC and interpretation of results are performed by qualified persons employing a QA/QC program consistent with NI 43-101 and industry best practices.
The Corporation has included certain non-IFRS financial measures in this news release, such as initial capital cost, sustaining capital cost, total capital cost, AISC, and capital intensity, which are not measures recognized under IFRS and do not have a standardized meaning prescribed by IFRS. As a result, these measures may not be comparable to similar measures reported by other corporations. Each of these measures used are intended to provide additional information to the user and should not be considered in isolation or as a substitute for measures prepared in accordance with IFRS.
Non-IFRS financial measures used in this news release and common to the gold mining industry are defined below.
Total Cash Costs and Total Cash Costs per Ounce
Total cash costs are reflective of the cost of production. Total cash costs reported in the PFS include mining costs, processing, general and administrative costs of the mine, off-site costs, refining costs, transportation costs and royalties. Total cash costs per ounce is calculated as total cash costs divided by payable gold ounces.
AISC and AISC per Ounce
AISC (all-in sustaining cost) is reflective of all of the expenditures that are required to produce an ounce of gold from operations. AISC reported in the PFS includes total cash costs, sustaining capital, closure costs and salvage, but excludes corporate general and administrative costs. AISC per ounce is calculated as AISC divided by payable gold ounces.
O3 Mining Inc., an Osisko Group company, is a gold explorer and mine developer on the road to produce from its highly prospective gold camps in Québec, Canada. O3 Mining benefits from the support, previous mine-building success, and expertise of the Osisko team as it grows towards being a gold producer with several multi-million-ounce deposits in Québec.
O3 Mining is well-capitalized and owns a 100% interest in all its properties (66,000 hectares) in Québec. O3 Mining trades on the TSX Venture Exchange (TSXV: OIII) and OTC Markets (OTCQX: OIIIF). The Corporation is focused on delivering superior returns to its shareholders and long-term benefits to its stakeholders. Further information can be found on our website at https://o3mining.com
This news release contains "forward-looking information" within the meaning of the applicable Canadian securities legislation that is based on expectations, estimates, projections, and interpretations as at the date of this news release. Any statement that involves discussions with respect to predictions, expectations, interpretations, beliefs, plans, projections, objectives, assumptions, future events or performance (often but not always using phrases such as "expects", or "does not expect", "is expected", "interpreted", "management's view", "anticipates" or "does not anticipate", "plans", "budget", "scheduled", "forecasts", "estimates", "believes" or "intends" or variations of such words and phrases or stating that certain actions, events or results "may" or "could", "would", "might" or "will" be taken to occur or be achieved) are not statements of historical fact and may be forward-looking information and are intended to identify forward-looking information. This forward-looking information is based on reasonable assumptions and estimates of management of the Corporation, at the time it was made, involves known and unknown risks, uncertainties and other factors which may cause the actual results, performance or achievements of the companies to be materially different from any future results, performance or achievements expressed or implied by such forward-looking information. Although the forward-looking information contained in this news release is based upon what management believes, or believed at the time, to be reasonable assumptions, the parties cannot assure shareholders and prospective purchasers of securities that actual results will be consistent with such forward-looking information, as there may be other factors that cause results not to be as anticipated, estimated or intended, and neither the Corporation nor any other person assumes responsibility for the accuracy and completeness of any such forward-looking information. The Corporation does not undertake, and assumes no obligation, to update or revise any such forward-looking statements or forward-looking information contained herein to reflect new events or circumstances, except as may be required by law.
Neither the TSX Venture Exchange nor its Regulation Services Provider (as that term is defined in the policies of the TSX Venture Exchange) accepts responsibility for the adequacy or accuracy of this news release. No stock exchange, securities commission or other regulatory authority has approved or disapproved the information contained herein.
")
")
SOURCE O3 Mining Inc.
